Running it to collect data, including some optional switches:
-n to give the run a name
$this->bbcode_second_pass_code('', '% stressberry-run -n "2.0 GHz Naked" naked.dat')
Plotting the data, this example includes some optional switches:
-f to include a 2nd y-axis showing the frequency
--not-transparent to give a white background
-l 200 2000 to limit the frequency range on the 2nd y-axis from 200 MHz to 2,200 MHz
-t 20 90 to limit the temperature range from 20 to 90 degrees
$this->bbcode_second_pass_code('', '% stressberry-plot -o caseless.png -f -l 200 2200 -t 20 90 caseless.dat')
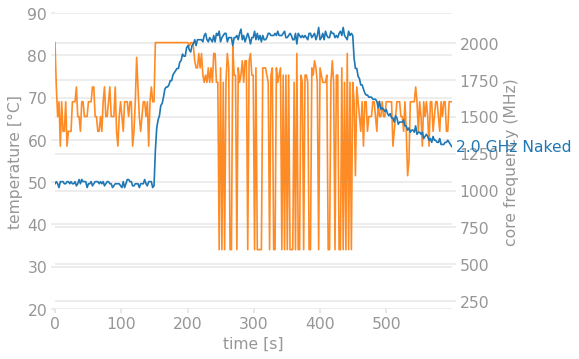
You can see by the orange line that the frequency was modulated once it hit the thermal limit of 85C.
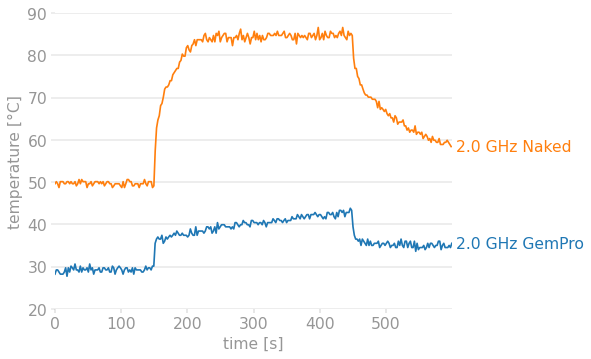
You can also stack multiple runs on the same x-y plot like this:
-f -l 200 2200 is omitted here as frequency plots are not supported on stacked examples.
$this->bbcode_second_pass_code('', '% stressberry-plot -o combined.png -t 20 90 gempro.dat caseless.dat')